Showing posts with label Google Analytics. Show all posts

Monday, 22 April 2019

Cross-Domain Analytics Tracking

The process of implement cross-domain tracking can be tricky and if not done correctly can fail or cause inaccurate information to be collected in the client’s analytic tools. There are many blog posts and columns to configure cross-domain tracking, however, what these posts don’t contain is why a business should or should not implement cross-domain tracking. What are the benefits of cross-domain tracking and are there any risks associated with it?

What is Cross-domain tracking?

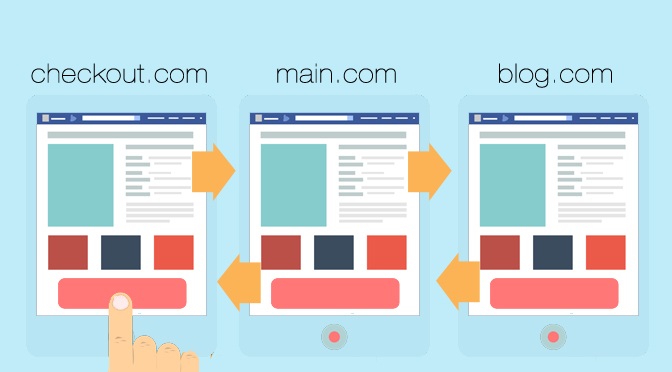
Cross-domain tracking makes it possible for Analytics to see sessions on two related sites as a single session. Cross-domain allows you to view a website visitor’s session as they navigate from one domain to another as part of a single customer journey from the point of acquisition to conversion.
When and when not to implement Cross-domain tracking?

Implementing a cross-domain tracking solution isn’t the answer to poorly configured website. First problem statement is - “If you go to our site with domain.com everything is fine, but you also get there with www.domain.com and everything is also fine, but as you navigate the site, sometimes a user gets the www and sometimes they don’t.” The answer is yes cross-domain tracking can help, but you’re better off having your admin fix it with one line in the .htacess file to either show the www or not show it every time.

Another problem statement is - “We have a few sites domainA.com, domainB.com and domainC.com and want to see how many people navigate between them.” This may sound like a perfect reason to implement cross-domain tracking, but when you dig a bit deeper and ask “Do you have links between your sites?” or “Are the sites related in some specific way?” and you get the answer “No!”, then what they are asking for isn’t cross-domain tracking, but rather “session stitching” which is far more complex to implement.

What cross-domain tracking, is truly intended for is connecting the data flow between related sites. For example, perhaps you have all your marketing landing pages on a sub-domain of www1.domain.com and clicking on the call to action takes the user to a different domain (perhaps to complete a form i.e., ecommerce.domain.com) and once they’ve completed this task they are then returned to your public site of www.domain.com with additional conversion opportunities. In this customer journey, a visitor would encounter three domains and as a business owner, you need to know which ads drove conversions and potentially if running A/B testing on landing pages which landing pages yield conversions. This is the perfect scenario to implement cross-domain tracking.

Perhaps you operated multiple domains in support of a common target audience that does link to each other and the services promoted on each of them. Once again, this is a perfect reason to implement cross-domain tracking as part of a roll-up analytics report.

While a bit of a stretch, if your organization operates multiple websites that aren’t linked together you can through some custom reporting and the use of Attribution Modeling and Multi-Channel reporting, view if a user visited associated websites (including which ones) before converting on the final one. This last option can be extremely tricky to implement, expensive and fraught with holes that may limit the reliability of the data. However, to some people, a bit of data is better than no data at all.

Tuesday, 15 January 2019

What is Attribution Modeling?

Understanding the steps a customer takes before converting can be just as valuable to marketers as the sale itself. Attribution models are used to assign credit to touch points in the customer journey.

For example, if a consumer bought an item after clicking on display ad, it’s easy enough to credit that entire sale to that one display ad. But what if a consumer took a more complicated route to purchase? Customer might have initially clicked on the company’s display, then clicked on a social ad a week later, downloaded the company app, then visited the website from an organic search listing and & converted in-store using a coupon in the mobile app. These days, that’s a relatively simple path to conversion.

Attribution aims to help marketers get a better picture of when and how various marketing channels play contributes to conversion events. That information can then be used to inform future budget allocations.

Attribution models - Following are several of the most common attribution models.

·         Last-click attribution. With this model, all the credit goes to the customer’s last touch point before converting. This one-touch model doesn’t take into consideration any other engagements the user may with the company’s marketing efforts leading up to that last engagement.

·      First-click attribution. The other one-touch model, first-click attribution, gives 100 percent of the credit to the first action the customer took on their conversion journey. It ignores any subsequent engagements the customer may have had with other marketing efforts before converting.

·      Linear attribution. This multi-touch attribution model gives equal credit to each touch point along the user’s path.

·     Time decay attribution. This model gives the touchpoints that occurred closer to the time of the conversion more credit than touchpoints further back in time. The closer in time to the event, the more credit a touch point receives.

·      U-shaped attribution. The first and last engagement gets the most credit and the rest is assigned equally to the touchpoints that occurred in between. In Google Analytics, the first and last engagements are each given 40 percent of the credit and the other 20 percent is distributed equally across the middle interactions.
Algorithmic or data-driven attribution - When attribution is handled algorithmically, there is no pre-determined set of rules for assigning credits as there is with each of the models listed above. It uses machine learning to analyze each touchpoint and create an attribution model based on that data. Vendors don’t typically share what their algorithms take into consideration when modeling and weighting touchpoints, which means the results, can vary by provider. Google’s data-driven attribution is just one example of algorithmic attribution modeling.

Custom attribution - As the name suggests, with a custom option, you can create your own attribution model that uses your own set of rules for assigning credit to touchpoints on the conversion path.

Benefits, limitations of attribution - Marketers face the ongoing challenge of being able to stitch all the various touchpoints available to their customers together for a grand view of attribution. There have been improvements, with greater ability to incorporate mobile usagein-store visits and telephone calls into models, but perfection is elusive.

As marketers invest in more channels and digital mediums, getting a unified view of a customer’s journey is only getting harder. “This will become ever more complicated by increased investments in influencer marketing and Amazon where there are significant challenges in creating unified IDs.

In addition to the customer journey tracking that (Google’s and Facebook’s attribution platforms) provide, we’ll likely see the development of variance analysis solutions within the platforms that will enable marketers to better understand the existing impact of their strategies. At an overarching level, the key takeaway here is the convergence of data across platforms and the ability to understand interactions that occur across channels in both an impression and click capacity.

Saturday, 27 October 2018

Reversing your Advertising Process

Most of the time advertisers work in one direction. We come up with an advertising concept or message, create an ad that matches, and then fill in the missing pieces between that ad and a completed scale: landing pages, forms, lead magnets, promotions, sales collateral and so forth. Then we want to improve things, we go back to our pieces and try to figure out how we could improve them. Poor CTR – Try tweaking the ad copy. Not enough sales – offer promotion.

Many big companies recognize this and use surveys or focus groups to try to get inside the heads of their target audience. However, that sort of in-depth research can be a bit hard to pull off. So we end up taking our best guess and making tweaks instead. This works well enough most of the time, but what do you do when your best advertising ideas still aren’t delivering adequate results? In this situation, it may be helpful to try reversing your advertising process. Instead of coming up with different ways to catch your customer’s eye, start by looking at what your customers are responding to on your website and landing pages.

Google Analytics – The easiest way to do this is to take a look at the messaging on the top-performing pages of your site. Landing page reports tells you how many people landed on a particular page and then went on to convert on your site. In other words, regardless of how they got to your site, these people saw something they liked on your site and converted. Once, you’ve identified the elements that make a particular page deliver the results you’re looking for, you can use that information to come up with a great ad.

Right Ad Strategy – When you get right down to it, you don’t really want people to click on your ads. You want people to convert. If people aren’t converting, every click you pay is a waste of money. Typically, most people recommend that you match your landing page to your ad and then split test your landing page. Instead of keeping the ads the same and testing the landing pages, keep the landing page the same and test different ads.

Identify one of your top landing pages and come up with a few different ads that match the messaging of your landing page. Then, set up a split test in your ad platform of choice and see which ad produces the best conversion rates. Most online advertisers see the journey from click to conversion as two separate processes, CTR and Conversion rates. Since we’re trying to reverse-engineer our advertising, we’re going to assume that the conversion rate of our landing page is directly influenced by the type and quality of traffic we’re sending to it. So, if our ads send better traffic to our landing page, our conversion rate will naturally improve.

Limitations – Reverse-engineering your ads from your landing page and site content comes with its own set of disadvantages. Conversion data only tells you what worked for the people who have converted, it doesn’t tell you much about what might work for new audiences. This approach is most helpful when you have quite a bit of existing conversion data and want to use that data to come up with new advertising ideas.

Online advertising is something of a tricky process. You know what you want to say and who to say it to, but figuring out the best way to say it can be hard. Your current customers have already given you a lot of information on what makes them want to convert. All you have to do is use that data to reverse-engineer an advertising strategy that really speaks to your audience.

Saturday, 20 October 2018

Implementing Cohort Analysis Modeling

When reporting paid search results, marketers often field a few recurring questions “How does search contribute to retention?” However, the ability to strategically and correctly answer these questions about search campaign effectiveness over time requires both deep reporting capabilities and a strong grasp of your organization attribution model.

Adoption of Cohort analysis as part of paid search reporting can be a powerful means to assess trends, retention and path to purchase. It also allows for greater accuracy when analyzing campaign results over a dedicated window of time based on the time it takes users to move through the funnel. In marketing, the term “cohort” describes segments of users who share specific events or experiences within a specific time frame. Cohorts include purchasers, email subscribers, trial and/or demo downloads or any other conversion action in the funnel.

Shifting to a Cohort model requires diligent up-front assessment and work, it’s crucial to ensure accurate data is being collected. The most important spreadsheet columns in this instance are the date and time stamps, such as “Original created date for the lead” and “Date when the lead transformed into its next stage” and so on. The date allows measurement of the time it takes for users to move through the funnel and application of that knowledge to paid search reporting and insights.
Once the right data is flowing and a statistically significant lookback window of results to review is available, it’s time to analyze the time it takes our users to pass through the sales funnel from paid search. To set up a Cohort analysis with ample data, shoot for a 6 – to – 12 month window of data. It’s vital to have a large enough date range so we don’t misinform paid search contribution to the marketing platform.

The Cohort model can be used to make faster and smarter search optimizations. It’s not practical to wait for 100% of our leads to move through the funnel before making decisions. Choose the right percentile to use instead. For example, taking the 75th percentile will help determine how many days it takes for the fastest 75% of our paid search leads to move through the funnel. This may significantly reduce the days between stages from previous analysis.

The key to developing accurate reporting is to ensure prospects; opportunities and customers aren’t being reported outside their time windows. This means if a customer window is 30 days, we’re not viewing any customer results unless they’re 30 days old and have had that time to mature. To get an accurate cost per customer in this instance, we also want to exclude spend from the most recent 30 days. We should only view spends in the maturity window for our customers or opportunities.

Cohort Analysis application for Paid Search

Forecasting - Understanding the flow and evolution of paid search cohorts in correlation to pipeline or revenue makes it much easier to forecast the behavior of a new subset of customers.

Retention strategy – Comparing cohorts by day, week or month of acquisition by revenue generated from that group over the next 6 – to – 12 months will shine a light on purchase and engagement habit changes. If repeat purchases don’t increase, it may be best to implement a retention or re-engagement strategy to guide users back to the sales journey.

Seasonality - Assessing date of first customer/purchase against repeat purchase will highlight users who fall off after a holiday or busy season. Using this data can help inform marketers whether they should double down post-season.

Geo-specific purchase behaviors – If employing international or geo-focused paid search initiatives, measuring revenue incurred month over month by location will make it clear where LTV thrives or dives by region.

Analysis models vary greatly, and shifting to a cohort analysis or model can be a big decision. For many marketers, such a move is necessary for working with lead-gen campaigns. Implementing cohort analysis into paid search reporting is often a powerful means of charting true long-term trends for retention, churn and attribution at a more granular level — and more importantly, bringing to light opportunities within paid search programs.

Sunday, 12 February 2017

Free tools in Digital Marketing

Every small business owner is well aware that, it is expensive to build an online business without the help of digital marketing tools. They also know that these various digital marketing tools greatly help them with their everyday tasks. SMEs and startups entrepreneurs can easily learn to master these free digital marketing tools and it will only boost their productivity.

Google Analytics – Launched in 2005, Google Analytics is undoubtedly the world’s most recognized free web analytics service. It has been setting industry standards by combining multiple analytical features for mobile as well as traditional user. Google Analytics must be the very first feature that you ought to install on your site. It will record just about everything, the moment that you go live and will track for you what is working and what isn’t. What make it unique are its tracking codes. The number of metrics that you get is incredible and to think that you get all of this for free.
Keyword Planner – It is a focused version of a combination of the Google Adwords. It is one of the best research tools available and is ideal for SEO purposes. There is multiple pertaining to keywords, but the tools focus is on a keyword’s traffic volume and competitiveness. You can search for relevant ideas pertaining to your keyword, assess the performance of a keyword, or try creating a combination of new keywords and a variety of options. It also has a free Adwords tool, for which the keyword planner helps in selecting competitive bids to use with your Adwords Campaigns.

BuzzSumo – It helps to provide more information to digital marketers through valuable content. Obvious that content marketing is not only essential to SEO, but to digital marketing as well. Just input the key phrase or long-tail keyword that you wish to promote and you get a list of the most popular posts that are currently trending. All you now have to do is to draft a suitable marketing strategy.
Hootsuite – It is one of those early multi-social networking clients, which integrated most of the popular Social Media platforms. This helps businesses, SMEs and startups to execute amazing Social Media strategies across their organizations so that their message is converted into relationships that matter. Hootsuite is an excellent SEO analysis tool for your Social Media accounts. In short, it is almost a necessary marketing tool for SMEs and startups in this digital age.

SimilarWeb – It is an online digital market intelligence tool that provides traffic and in-depth marketing insights for any website. With a single click, users can not only get a quick overview of a site’s ranking and reach but also its user engagement. By entering a specific website URL, or doing a category search by industry or country users get access to data from the top 50 websites. This will help users discover their market position by comparing key digital metrics, with direct competitors and leading companies and also craft suitable marketing strategies.
Boomerang – It is one of the more unique and good email marketing services that allow you to monitor your full email campaigns with ease. Boomerang, an effective plugin for Gmail, will schedule outgoing emails to hit consumer inboxes at an optimum time. You can also set up the “boomerang” effect where you can have the outgoing email send back to you when you haven’t gotten a reply from the original recipient thus making it an effective email follow up reminder. Boomerang not only allows you to create and monitor your email campaigns with ease, but is also easy to integrate with your Social Media accounts.

SEMrush – It helps to research your competitor’s keywords and helps you dominate your niche in search rankings. Most digital marketers have indicated that SEMrush as one of the best SEO and competition analysis tool out there. Developed by SEOQuake, SEMrush tool is an awesome tool to analyze your competitor website traffic, check their backlinks, find better if not suitable keywords and also helps you fix any website issues.
Hotjar – It is a powerful marketing tool that has been designed specifically for webmasters to analyze and study their traffic better. It is a complete website and mobile analytics tool that enables web developers, analysts, digital marketers and UI developers etc. to optimize the usability and conversion rate of their sites. Hotjar combines both feedback and analysis tool to give users understandings into how visitors interact with their website, how they could enhance that visitor experience and finally what they can do to increase conversion rates.

Canva – It is a free simple graphic design tool for non-designers to create info-graphics as well as other presentations, visuals and graphics. Canva has a huge range of info-graphics, images, visuals, layouts, and templates for your Social Media, Content Marketing, Blogging and at times even advertising needs. It is a much needed free tool that simplifies the design process. 
SimplyMeasured – It is a marketing tool that is used by SMEs, startups as well as large corporations. It provides them social media analytics and metrics to measure their online media campaigns, social media performance etc. and also assist them in the monitoring of online mentions of specific keywords which triggers for specific instances.

Charlieapp.com – Charlie is must have tool. Just before a meeting, it compiles just about all the important info about the people that you are scheduled to meet, and stores them in your organizer or diary. You will have most of their personal info, such as common hobbies that you share, personal preferences, and their professional history, and much more which breaks the ice in any meeting.
SocioBoard – Social Media platforms have also played an important part in digital marketing. Likewise businesses manage multiple Social Media platforms and their activities. The SocioBoard platform being an open source tool makes it very easy for digital marketers, SMEs and startups.

Wistia – It provides online professional video hosting services for businesses, individuals, SEMs and startups. It is very much a pro-business oriented service, and helps SMEs to grow their brand and business. It tracks marketing performances through its built in metrics, analytics, and video marketing tools. Wistia also has tools for customizing videos, building brand awareness, increasing traffic via video SEO, and generating new leads.
SlideShare – The quiet giant of content marketing, SlideShare is the biggest, albeit simple photo slideshow software, that provides professional results. SlideShare gets over 130 million page views and over 60 Million visits every month. It is among the 200 most visited websites and is also the largest community for sharing presentations. Apart from presentations, SlideShare also supports PDF’s, documents, webinars and videos. It offers a variety of input and output choices as well as editing tools with images, effects, transitions and music.

Rapportive – It shows just about everything connected with the contacts in your Gmail Inbox. It will put up the Social Media details of the email sender. This is a free blogging tool and is blessings in disguise for those who receive tons of Gmail from you don’t know. Rapportive helps you get a peep into who is behind the email address. It also allows you connect with Social Media profiles of these emailers. In addition, it is the perfect tool if you are contemplating to bring LinkedIn functionality to your Gmail Inbox.